
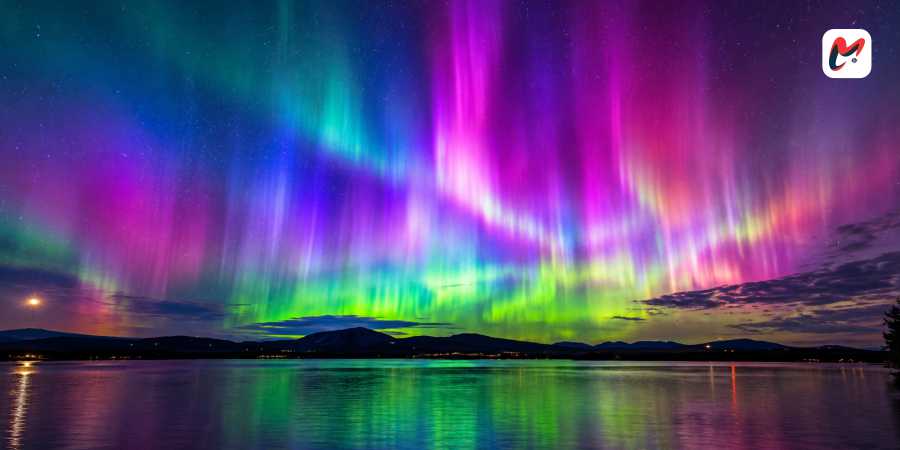
Watching the Northern Lights is part science, part patience and part timing. The sky may remain dark for hours before suddenly filling with green curtains, purple edges or shimmering bands of light. Yet a successful aurora outing rarely depends on luck alone. Understanding solar activity, geomagnetic forecasts, cloud cover and local darkness can help observers make better decisions about when and where to look. Learning how to interpret a Northern Lights Aurora Borealis forecast is particularly useful because the numbers on a space-weather dashboard do not always translate into a spectacular display overhead.
The aurora begins with activity on the Sun. Solar flares and coronal mass ejections can release energy and charged particles into space. When these disturbances interact with Earth’s magnetic field and upper atmosphere, they can trigger auroral displays. Oxygen and nitrogen atoms and molecules emit light as they respond to incoming energy, producing the colours visible from the ground. The National Oceanic and Atmospheric Administration’s Space Weather Prediction Center (NOAA SWPC) monitors these conditions and publishes forecasts that help observers assess potential aurora activity.
Understanding the Kp Index
One of the most familiar numbers in a Northern Lights Aurora Borealis forecast is the Kp index. It measures disturbances in Earth’s magnetic field on a scale from 0 to 9. Lower readings generally indicate quieter geomagnetic conditions, while higher values suggest stronger disturbances that can allow auroras to become visible farther from the polar regions.
A Kp value of 5 or above is commonly associated with a geomagnetic storm. NOAA classifies storms from G1, or minor, through G5, or extreme. These classifications describe geomagnetic conditions rather than guaranteeing a particular visual experience at a specific location.
The important detail is that Kp is a broad indicator, not a personal viewing forecast. A high reading may create opportunities at lower latitudes, but clouds, daylight, light pollution and the direction of the auroral oval still matter. Conversely, observers in northern Norway, Iceland, Alaska or northern Canada may see auroras during relatively modest geomagnetic activity because these locations sit closer to the region where auroras occur most frequently.
Solar Flares and Coronal Mass Ejections
Solar activity is another major element of aurora forecasting, but not every event on the Sun produces visible lights on Earth. Solar flares are sudden releases of energy and radiation. They can affect radio communications and other systems, but the flare itself does not necessarily send the material needed to produce a strong aurora.
Coronal mass ejections, often called CMEs, are enormous releases of plasma and magnetic field from the Sun’s outer atmosphere. If a CME travels toward Earth, it can disturb the magnetosphere when it arrives. Travel time varies, but an Earth-directed CME may take roughly one to several days to reach our planet, giving forecasters time to assess its likely impact.
For people tracking a Northern Lights Aurora Borealis forecast, this distinction is useful. A report about a powerful solar flare can attract attention, but the direction, speed and magnetic properties of associated solar material help determine whether strong auroras are likely. Space-weather agencies refine their predictions as spacecraft measurements provide more information about approaching solar wind.
What the Bz Reading Tells You
More detailed forecasts include the interplanetary magnetic field, particularly its north-south component known as Bz. When Bz points southward for a sustained period, it can connect more effectively with Earth’s northward-pointing magnetic field on the dayside, allowing energy to enter the magnetosphere. This can support stronger geomagnetic activity.
A strongly negative Bz reading can therefore be encouraging, especially when solar wind speeds are elevated. However, Bz can change direction, sometimes quickly, so a single reading is not a reliable promise of a display. Observers should look at recent trends alongside the Kp index, solar wind speed and other space-weather measurements.
This is where a Northern Lights Aurora Borealis forecast becomes more than a simple green, yellow or red map. The map may show where aurora activity is expected, while the underlying measurements help explain why conditions could strengthen or weaken. Checking updated data shortly before heading outside is often more useful than relying on a forecast viewed many hours earlier.
Reading Aurora Maps and Geomagnetic Alerts
NOAA SWPC provides aurora forecasts, geomagnetic storm alerts and short-term maps showing the expected visibility of auroras across the Northern Hemisphere. Its aurora forecast products include a 30-minute prediction based on current solar wind and geomagnetic conditions. This is useful for immediate decisions, although such a short-term outlook cannot eliminate local uncertainty.
A forecast map typically shows an auroral oval around the magnetic pole. Brighter or more active regions can indicate stronger aurora emissions, while an estimated viewing boundary helps show where the display might become visible. The exact interpretation depends on the map’s legend and whether it displays expected auroral intensity or the likelihood of viewing.
Geomagnetic alerts use NOAA’s G-scale to describe storm severity. A G1 alert signals a minor storm, while G3 represents a strong storm and G5 an extreme one. These alerts are useful indicators of space-weather conditions, but they should not be mistaken for guarantees that every location within a broad region will see the lights. Forecasts describe the atmosphere and magnetic environment, not the weather at your campsite.
Separating Reliable Forecasts from Online Hype
Social media can be helpful for seeing real-time photographs and reports from observers, but dramatic claims about a coming aurora should be checked against official information. Posts promising a once-in-a-lifetime display may rely on an isolated solar flare, an outdated Kp prediction or a map that shows possible visibility rather than certainty.
The NOAA Space Weather Prediction Center is a useful source for US and global space-weather monitoring. The British Geological Survey and national meteorological services also publish information about geomagnetic activity and aurora visibility. Comparing these sources can help distinguish a developing event from speculation.
Photographs require some context, too. Modern cameras can capture faint colours and structures that are difficult to see with the naked eye, particularly during weak displays. A photograph showing vivid purple or red light does not necessarily mean that an observer standing beneath the same sky will see equally intense colours.
In due course, reading a Northern Lights Aurora Borealis forecast is about understanding probability rather than searching for a guaranteed answer. Solar activity indicates what may be developing, geomagnetic measurements reveal how Earth is responding, and local conditions determine whether the display is visible. By combining reliable alerts with clear skies, dark surroundings and realistic expectations, observers can make better-informed choices and enjoy the experience without treating every forecast as a promise.